31 December 2013

NIFTY - ELLIOTT WAVE UPDATE

Hi Frends,

As mentioned in my previous post Nifty seems to be in Final Z leg of the 2 year long up trend. Nifty seem to have completed Z leg at 6415.
NIFTY
 After testing 6415 Nifty fell sharply towards 6130 in 7 trading sessions. This fall seems to be wave (i) or 'a' of one higher degree. The rise from 6130-6345 looks corrective, & consumed 7 trading sessions & retraced around 78.6% of the fall.  This rise seems to be wave (ii) or b of one higher degree. Break below 6270 would be initial indication of start of next leg down in wave (iii) or 'c' and break below 6190 would further confirm the downside.

Once below 6190 we may expect fall towards 5970-5700. In case of 3rd wave extension Nifty might fall below 5700. As per my preferred count break below 6190 would indicate huge downside back to 5100. Break below 5700 will further confirm it.

Alternatively if one is counting the rise from 5118-6415 as Leading Diagonal; still needs to wait for some corrective fall to 5700 for next leg up in 3rd wave.

I would stick to my long term views. As per my Time Cycle study Nifty is in 7 year long sideways Bear Market and 1 last huge fall is pending before the Bull Run starts in 2015. I would like to review for alternate wave count only if Nifty doesn't fall below 5700 till Feb 2014.


Thanks & Regards,

Harsh Dixit.

9 December 2013

NIFTY - EW ANALYSIS

Hi Friends,

As I have been mentioning in my posts Nifty seem to be in Huge Ending Structure from Last 2 years from 4531. Currently it seems to be in (Z) wave of this Structure.
NIFTY
In November Nifty fell sharply after testing 6340 levels on Diwali. However, Bulls protected the important support of 5970. As per my reading the sharp rise from 5120 looks like an Ending Diagonal. And Nifty is likely to complete final 'e' leg of this Diagonal near 6460.

Post completion of this Ending Structure we might witness a Huge Downside back to 4500 or lower in a year ahead. Whenever we get the evidence of the end of this move I would be looking for immediate downside to 5970.  If this Pattern is true post completion Nifty might fall sharply to 5090 till End of Jan 2014 or even lower to 4760 till End of March 2014.

Alternatively 1 may call the Rise from 5118-6343 as a Leading Diagonal in Wave 1 of New Bull and The Dip to 5972 as wave 2. So if one who is looking at the rise from 5972 as Wave 3 should be aiming for much higher targets.

However, Wave Analysis of the Nifty-50 Stocks & Other Indices don't support the Idea of the New Bull. We are probably close to End of 2 year Long Up Trend rather than Beginning of New Bull Trend.

I would like to review the alternate structure only if Nifty sustains above 6450-6500 levels on monthly closing basis.

Thanks & Regards,

Harsh Dixit.

25 November 2013

GLOBAL MARKETS

Hi Friends,

Lets look at the Global Markets which are Ready for a Long Term Trend Change.

DJIA

DJIA
As mentioned in my previous post DJIA seems to be in Expanding Pattern. The Rally from 2009 Lows looks a Corrective Rally and not a Directional move or Impulse.

The Rally seems to be in its final phase with Intermediate Degree (Y) in play. DJIA has Strong Resistance near 16100-200 and upside looks limited. Break below 15300 will indicate medium term trend change. And break below 13670 will invite a huge downside back to 2009 Lows.


DAX
DAX

As mentioned in my previous post Germany DAX seems to be in huge sideways pattern since 2000. Currently it seems to be in Cycle Degree Wave 'D'. With Z underway inside(Y).

DAX seems to in final leg of Z and upside looks limited to 9300. Close below 8500 will be Indication of a next leg downward in Cycle Degree 'E' Wave which could take the Index towards 5000.


FTSE 100
FTSE 100
 As mentioned in my previous post FTSE 100 seems to be in huge sideways pattern since 2000. Currently it seem to have completed Cycle Degree Wave 'D' With Intermediate Degree (Y) seems to be complete at 6875

FTSE 100 may not have much upside potential above 6800 in wave 2. Break below 6600 would be initial indication of start of minute degree wave 3. Close below 6300 will be confirmation of a next leg downward in Cycle Degree 'E' Wave which could take the Index towards 3800.


Thanks & Regards,

Harsh Dixit.

8 November 2013

STOCKS - EW COUNTS

Hi Friends,

Today I'm Posting my Wave counts on Few Stocks which might be ready for medium to long term Trend Reversal. 

ACC
ACC
ACC formed Head & Shoulder pattern. After break down the stock retested the neckline, which seems to be wave B Pullback. It is expected to decline in wave C to 700 to complete the head target.

ASIAN PAINTS
ASIAN PAINTS
Stock seem to have completed extended wave 3 near 560. It formed an Ending Diagonal in (v)th wave. Move below 520 may signal start of next leg down. Stock may drop to 340 or even 250 in wave 4 down.

AXIS BANK
AXIS BANK
Axis Bank seem to have completed pullback in wave 2 or B up near 1260. The stock closed below short term EMA supports. Move below 1160 would signal start of next leg down. As per wave equality stock may drop to 490 in wave 3 or C down till March 2014.


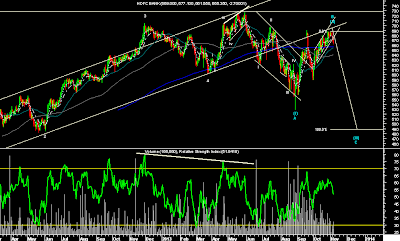
HDFC BANK
HDFC BANK
HDFC Bank seem to have completed pullback in wave 2 or B up near 690. The stock closed below short term EMA & Channel supports. Move below 655 would signal start of next leg down. As per wave equality stock may drop to 490 in wave 3 or C down till March 2014.


HDFC LTD
HDFC LTD
HDFC LTD seem to have completed pullback in wave X uo near 865. The stock closed below short term EMA support. Move below 815 would signal start of next leg down. As per wave equality stock may drop to 570 in wave Y down till March 2014.

ICICI BANK
ICICI BANK
ICICI Bank seem to have completed pullback in wave 2 or B up near 1140. The stock closed below short term EMA supports. Move below 1000 would signal start of next leg down. As per wave equality stock may drop to 660 in wave 3 or C till March 2014.


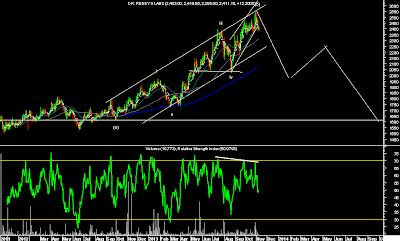
DR REDDY
DR REDDY
Stock seem to have completed wave 5 near 2500. It formed an Ending Diagonal in (v)th wave. Move below 2350 may signal start of next leg down. Stock may drop to 1600 in next wave down.


TATA MOTORS
TATA MOTORS
Tata Motors has formed huge weekly Ending Diagonal Pattern.. The pattern seems to be complete near 400.  Move below 370 would signal a start of huge correction. Stock may drop to 210-180 in next 12-15 months.


Thanks & Regards,

Harsh Dixit.

5 November 2013

INDIAN INDICES

Hi Friends,

Today I'm Posting my Wave Counts on Few Indices which might be ready for Huge Trend Reversal.

NIFTY
NIFTY
As mentioned in my previous post Nifty seem to be in Huge Ending Structure from Last 2 years from 4531. Whether Ending Diagonal or Complex Correction the labels don't matter until we know its just a Corrective Rally. Currently it seems to be in (E) or (Z) wave of this Structure. And this Rally is about to die.

As per my reading Nifty is close to completing final 'e' leg of this Final (E) or (Z) wave which might end near 6355.  As mentioned in my previous post we achieved the target of 6334 till Nov 1st week i.e. till Diwali. The upside from here looks very limited and Nifty may face stiff Resistance at 6355-6420. Upside if any shall be used to exit longs. Strictly avoid fresh longs at current levels. 

Post completion of this Ending Structure we might witness a Huge Downside back to 4500/4000 or lower in a year ahead. Whenever we get the evidence of the end of this move I would be looking for immediate downside to 5690 till 1st week of Dec 2013 and 5090 till Jan 2014 and 4760 till March 2014.


BANK NIFTY
BANK-NIFTY

After testing the Life Time Highs in May 2013 near 13400 Bank-Nifty fell sharply almost back to 2011 lows near 8400. It's a clear 5 wave decline which might be marked as wave 1 or A. Currently Bank-Nifty is close to completing wave 2 or B and may face resistance at 11800. Post completion of this corrective pullback it is expected to resume the down trend. As per wave equality Bank-Nifty may Fall upto 6700 in wave 3 or C till March 2014.


BSE AUTO INDEX
BSE AUTO INDEX
BSE Auto Index is at Life Time Highs. However, The Rally from 2011 lows lacks the characteristics of an Impulse. Index seems to be in Expanding Formation. Where X wave retraced more than 1.618 of W. Currently X wave seems to be in completion and has limited upside to 12400. Post Completion Index may Decline in Y wave down back to 2011 lows near 8000.

BSE HEALTHCARE INDEX
Index making New Highs week over weeks. However, RSI Negative Divergence is suggesting Possible Trend Change. Investors may get shock in next wave down. Index may drop to 7680 in a year ahead.


Thanks & Regards,

Harsh Dixit.

21 October 2013

NIFTY- IS IT A NEW BULL OR ON THE VERGE OF ENTERING NEW BEAR?

Hi Friends,

Nifty has given a Fast and Furious Rally from the low of 5118. Within 1.5 months Index has gained more than 20%. Index has reached near the Life Time High and the consensus is that this is a start of New Bull. Not only retail but Few Analysts have started believing in New Bull and postulating a Target of 7300-7800-8400 on Nifty in 2 years..

But are we really entering a New Bull? My Chart reading don't support any evidence of New Bull. Before entering a New Bull there is always some consolidation for 3-6 months. However no such consolidation was visible near 5118. Instead there are signs of distribution near 6200.
NIFTY
As mentioned in my previous post Nifty seem to be in Huge Ending Structure from Last 2 years from 4531. Whether Ending Diagonal or Complex Correction the labels don't matter until we know its just a Corrective Rally in (E) or (Z) wave of this Structure. And this Rally is about to die.

As per my reading Nifty seem to be in 'c' leg of this Final (E) or (Z) wave which might end near 6237-6256-6282. And we might see a move down to 6033-5981 in next few trading sessions in 'd' leg.  If Nifty holds the support near 5981-6033 we might see another move in'e' leg to 6319-6334 till Nov 1st week. This final (E) or (Z) might be developing as an Ending Diagonal itself. And as per seasonality Market is expected to remain Up till Diwali.

The upside from here looks very limited and shall be used to exit longs. Strictly avoid fresh longs at current levels. Post completion of the Ending Structure we might witness a huge down side back to 4500 or lower in a year ahead. Whenever we get the evidence of the end of this move I would be looking for immediate downside to 4900-5000 till Jan 2014.

Thanks & Regards,

Harsh Dixit.

7 October 2013

COMMODITIES

Hi Friends,

Today I'm posting my EW Counting on some Global Commodities.

CRUDE MCX
CRUDE MCX
MCX Crude has been consistently in uptrend since early 2009. It made all time high near Rs.7800 in Aug 2013. However, from EW perspective this entire rally looks corrective move. This entire move looks to be a Expanded Flat (B) wave which looks complete near Rs.7800. An Impulsive Fall in Flat (C) could take CRUDE back to 2009 lows near Rs.2000. 

CRUDE WTI
WTI CRUDE
WTI Crude has been consistently in uptrend since early 2009. However, from EW perspective this entire rally looks corrective move. This entire move looks to be a (B) wave which still has upside near $115. An Impulsive Fall in (C) could take CRUDE back to 2009 lows near $35.

GOLD MCX
GOLD MCX
MCX Gold has been consistently in uptrend over past few years. It seems to be in its Extended 3rd wave. Currently it seems to be in (v)th of 3rd which might be extending. The downside looks limited to Rs.27000. Post this correction Gold is likely to resume the uptrend and head towards Rs.40000 in next 2 years.

GOLD USD
GOLD-USD
Gold-USD has been consistently in downtrend ever since it made a top in (V)th wave near $1920 in Sept 2011. Currently it seems to be in complex correction or triple zigzag of which x seems to be in play. This corrective up move in x wave might take Gold to $1500. Post completion a move in Z wave can take Gold near $1030 or worst case towards wave (IV) low near $730.

SILVER MCX
SILVER MCX
MCX Silver seem to have completed the huge correction in Wave 4 near Rs.38500 in June 2013. With the sharp up move it seem to have resumed the uptrend in 5th wave which might be extending. The downside looks limited to Rs.45000. Post this correction Silver is likely to resume the uptrend and head towards Rs.80000 and higher to Rs.1,00,000 in next 3-4 years.

SILVER USD
SILVER-USD
Silver-USD has been consistently in downtrend ever since it made a top in (V)th wave near $50 in Apr 2011. Currently it seems to be in complex correction or triple zigzag of which x seems to be in play. This corrective up move in x wave might take Silver to $27. Post completion a move in Z wave can take Silver near $12 or worst case towards wave (IV) low near $8.


Thanks & Regards,

Harsh Dixit.
29 September 2013

DJIA - CAN FED SAVE U.S. EQUITIES FROM THE FINANCIAL TSUNAMI

Hi Friends,

In it's latest meeting on 18th Sept. 2013 the Federal Reserve unexpectedly refrained from reducing the $85 billion pace of monthly bond buying, saying it needs more evidence of lasting improvement in the economy and warning that an increase in interest rates threatened to curb the expansion.

So the message from FED is clear that it cannot Taper QE until Economic Conditions Improve. So it's clear that only QE is holding the U.S. Equities Up and not the Economy. But how Long FED will continue the QE? Probably Bernanke would never Taper, retire and leave the mess for the next elected person. Bernanke's term is ending at the end January 2014. So we might witness a policy change with the next elected person.

Wave Analysis:-
DJIA
Though there is uncertainty over the FED's Policy Decision and likely Future Economic & Market Outlook; Chart Patterns are suggesting a Financial Tsunami or a Huge Bear Market Crash in DJIA for the next 2 years.

As mentioned in my previous post DJIA seems to be in Expanding Pattern since 2000. The Rally from 2009 Lows looks a Corrective Rally and not a Directional move or an Impulse.

The Rally seems to be in its final phase with Intermediate Degree (Y) in play. DJIA has Strong Resistance near 16100 and upside looks limited. The Strong Negative Divergence in RSI on weekly charts is suggesting a possible Trend Change. Such Divergence was earlier witnessed at 2000 & 2007 Top. Break below 15000 will indicate medium term trend change. And break below 13660 will invite a huge downside back to 2009 Lows and even Lower to 5670.

At this point of time such a Forecast will sound absolutely ridiculous. But the current pattern on DJIA shows a high probability of test of 2009 lows. Such patterns have occurred in past on DJIA. There is no hard and fast rule as to occurrence of the similar pattern will produce similar price action in future. But we simply cannot ignore this pattern.


Trigger for this pattern to come true will be break bellow weekly Channel i.e. currently near 13660.


Thanks & Regards,


Harsh Dixit.

23 September 2013

GLOBAL MARKETS

Hi Friends,

Lets look at the Global Markets which are Ready for a Long Term Trend Change.

NIFTY
NIFTY
As mentioned in the previous post a close above 6060-6090 has invalidated the previous count. The move from 5118-6142 has retraced more than 78.6% of the fall in faster time. So it doesn't qualify for a correction of the previous fall. So a little change in short term counts.

Nifty seem to have completed (C) Wave at 6229 & the Fall from 6229-5118 was (D) Wave of the Larger 'C'. Current move seems to be'a' of (E) and Nifty might retrace in wave 'b' to 5798-5811-5833. And then 'c' of (E) might head to 6249-6289-6311.

This view will be valid until Nifty holds 5798-5811. A close below 5798 would mean end of (E) at 6142. Then I would be looking for a fall sub 5000.

In short term though Nifty might have upside towards 6300 I would stick to the Bearish view 
starting from October.


DJIA
DJIA
As mentioned in my previous post DJIA seems to be in Expanding Pattern. The Rally from 2009 Lows looks a Corrective Rally and not a Directional move or Impulse.

The Rally seems to be in its final phase with Intermediate Degree (Y) in play. DJIA has Strong Resistance near 16000 and upside looks limited. Break below 15000 will indicate medium term trend change. And break below 13660 will invite a huge downside back to 2009 Lows.


DAX
DAX
As mentioned in my previous post Germany DAX seems to be in huge sideways pattern since 2000. Currently it seems to be in Cycle Degree Wave 'D'. With Z underway inside(Y).

DAX seem to have completed Z and upside looks limited to 8900. Close below 8100 will be Indication of a Next leg downward in Cycle Degree 'E' Wave which could take the Index towards 5000.


FTSE 100
FTSE 100
As mentioned in my previous post FTSE 100 seems to be in huge sideways pattern since 2000. Currently it seem to have completed Cycle Degree Wave 'D' With Intermediate Degree (Y) seems to be complete at 6875

FTSE 100 may not have much upside potential above 6700 in wave 2. Break below 6500 would be initial indication of start of minute degree wave 3. Close below 6100 will be confirmation of a Next leg downward in Cycle Degree 'E' Wave which could take the Index towards 4000.


Thanks & Regards,

Harsh Dixit.

18 September 2013

FATE OF I.T. STOCKS

Hi Friends,

While the Broad Market has been slashing since Jan 2013 I.T. has been the place to hide. I.T. stocks are outperforming the Market and have produced superior returns over a year. But How Long This Out-performance will continue?? Technical charts suggest this I.T. Boom is perhaps over and I.T. stocks are ready to take a hard crash over a year.

BSE I.T. INDEX
BSE I.T. INDEX
The Index seem to have completed a Huge Diagonal and looks ready tumble from the sky. Upside if any looks limited to 8200.. But the Index faces huge Downside risk of 4500 over a span of 12-15 months..

HCL TECH
HCL TECH
HCL seem to have completed its 3rd Wave inside Extended (III)rd Wave.. And it may now retrace to 850 in 4th of the Extended (III)rd Wave. 5th of (III)rd may again head towards 1100. Post Completion of (III)rd stock may fall to 670 in Wave (IV).

INFOSYS
INFY
INFY seem to have completed the corrective Rally in B/X Wave at 3173.. Stock is taking resistance of the Long Term 2-4 trend-line.. And upside looks very limited to 3210. The stock is expected to crash to 1200-1000 in it's Y/C Wave over next 12-15 months.

TCS
TCS
TCS seem to have completed a 5 Wave move from the 2009 lows.. 5th achieved the Wave Equality to 3. So the Stock might be ready to correct to 1160 over next 12-15 months.

WIPRO LTD
WIPRO
WIPRO seem to have completed the corrective Rally in X wave at 492. And upside looks very limited to 500. The stock is expected to crash to 270 in it's Y Wave over next 12-15 months.


Thanks & Regards,

Harsh Dixit.
17 September 2013

NIFTY - POWER OF ELLIOTT WAVE

Hi Friends,

In my last post around 5200 I mentioned about a Fierce Rally to 5800 and higher based on the observation of Elliott Wave Pattern and the implication of similar pattern in 2011. Within no time Nifty Rallied to 5957. It Almost retrace 78.6% of the Entire Fall from 6229-5118. So what next?

As mentioned in my last post this Fierce Rally seems to be a corrective Bear Market Rally. As per my preferred count Nifty seem to have completed (x) Wave at 5957. Now it shall resume the downtrend and may witness a Huge Sell off sub 5000 in next 2-3 months in (y) Wave.
NIFTY
Nifty has Trendline and Fibonacci Resistance at 5991 and upside if any looks limited. Current pattern is similar to 2011. RSI is showing Hidden Divergence which is early indication of possible Trend Reversal. In 2011 too Nifty Retraced around 78.6% of the previous Fall in (w) Wave and Developed Hidden Divergence on RSI around 4945 in April 2011. Later Nifty fell badly towards 4700 in (y) Wave till August 2011. So we may witness similar Sell off to 4700-4800 till end of December 2013.

In Short Term a Close below 5815-5795 will indicate a Trend Reversal. As per Wave Equality Nifty is expected to fall to 4845 by end of December 2013 considering the Top at 5957. In case of Wave Extension Nifty may witness Sell off to 4545 or 4420 or even lower.

Current view will be invalidated only if Nifty closes above 6060-6090. A close above 6060-6090 will change the short term view. Still in Long Term I would stick to my Bearish views for Market. The Broad Market has already topped out in Jan 2013. But the Index is not reflecting the true picture. Index is trading at Highs due to few heavy weight stocks which are comparatively trading at the Highs. But soon these stocks will start tumbling too. In a year ahead the Banks, I.T., FMCG & Heath-care stocks are expected to fall from 40-70%. Which will drag Index lower.

Thanks & Regards,

Harsh Dixit.

29 August 2013

NIFTY DEJA VU

Hi Friends,

It has been a challenging Market for traders with daily Gap Ups 0r Gap Down in Nifty. The trend resumed down since late July. And there is no respite to Bulls. Earlier the Broad Market was slashing hard and later Index too started slashing harder. One question which everyone asking is "How much lower it will go?" In Bear Market nothing is too low. The Trend continues until there is a selling climax and the sentiments are extremely negative.

Currently sentiments are negative with lot of negative News from Domestic and Global front. Today morning Nifty witnessed a heavy sell off and next month Future Premium almost vanished during the sell off..
And now when market has dropped almost 1000 points in a month traders are expecting further downside to 4800. All these factors somewhat reflect the signs of Panic Bottom.

With the hammer on Daily chart and Positive Divergence on RSI some trend reversal looks round the corner. Though currently there is no evidence of reversal.. The Trend will change upon breakout of the falling channel.


NIFTY
Lets focus on some Interesting observations I have come across. In the above chart look at the comparison of the current fall to that of Early 2011. EW wise current fall form 6229-5118 looks like a larger corrective (w) similar to that of 6338-5178.. In 2011 wave 'b' inside (w) retraced 78.6% of wave 'a' and then 'c' almost retraced 161.8% of 'a'. Current fall looks similar with 'x' retracing 78.6% of w and 'y' almost done 161.8% of 'w'. So the larger degree (w) looks complete today and downside from here looks limited to 5023 which is exact 161.8% of 'w'. 

The trend will change only upon breakout of the falling channel. And then Nifty may retrace this entire fall by 61.8-78.6% similar to that of 2011 in (x) wave.. There is no hard and fast rule as to how much (x) may retrace. But technically higher end f the larger channel shall be the tgt of this (x) wave. So upon reversal we may expect pullback upto 5800..


Thanks & Regards,

Harsh Dixit.

21 August 2013

EW ANALYSIS OF FEW STOCKS

Hi Friends,

Today, I'm posting my EW view on few stocks.

Axis Bank

A clear 5 wave in Wave 1/A seems over. As long as it holds 950 pullback in wave 2/B towards 1160 or 1250 on cards.

HDFC Bank

Corrective decline seems over. As long as it holds 560 a pullback towards 640 seems to be on cards..

HDFC LTD

Corrective decline seems over. As long as it holds 700 a pullback towards 800 seems to be on cards.

ICICI Bank

A clear 5 wave in Wave 1/A seems over. As long as it holds 790 pullback in wave 2/B towards 915 or 960 on cards.

IDFC

As long as it holds the channel support of 95 a pullback towards 115 or 120 seems to be on cards.

LIC Housing Finance

As long as it holds 150 a pullback towards 185 or 195 seems to be on cards.

ITC

The stock is consistently in uptrend. Correction in IVth wave seems over and as long as it holds 305 it might head up to 370-380 in Final Vth wave.

Infosys

Time to move out of I.T. stocks. Infosys still might have upside towards 3200. But post this Rally A huge decline to 2200 seems to be on cards.

HCL Tech.

Another stock which is consistently in Up Trend. The stock still may have upside to 1000. However any rally shall be used to exit longs.

Maruti

A 5 wave decline in wave 1/A seems over. As long as it holds 1250 a pullback upto 1425-1460 seems to be on cards.

Coal India

A larger Corrective decline seems over. As long as the stock hold channel support of 245 a huge bounce upto 310 or 330 seems to be on cards.

DLF


A Clear 5 wave decline from 290-120. As long as it holds 139 pullback to 175-185 seems to be on cards.

JP Associates

Extended 3rd wave seems over. A pullback in 4th wave to 41 seems to be on cards.

Jindal Steel

Extended 3rd wave seems over. A pullback in 4th wave to 260 or 290 seems to be on cards.

Tata Steel

Another Metal Sector stock in Bear grip. Currently seems to be in 'B' of Y.. A relief rally towards 290-325 seems to be on cards.


Thanks & Regards,

Harsh Dixit.