Hi Friends,
It has been a challenging Market for traders with daily Gap Ups 0r Gap Down in Nifty. The trend resumed down since late July. And there is no respite to Bulls. Earlier the Broad Market was slashing hard and later Index too started slashing harder. One question which everyone asking is "How much lower it will go?" In Bear Market nothing is too low. The Trend continues until there is a selling climax and the sentiments are extremely negative.
Currently sentiments are negative with lot of negative News from Domestic and Global front. Today morning Nifty witnessed a heavy sell off and next month Future Premium almost vanished during the sell off..
And now when market has dropped almost 1000 points in a month traders are expecting further downside to 4800. All these factors somewhat reflect the signs of Panic Bottom.
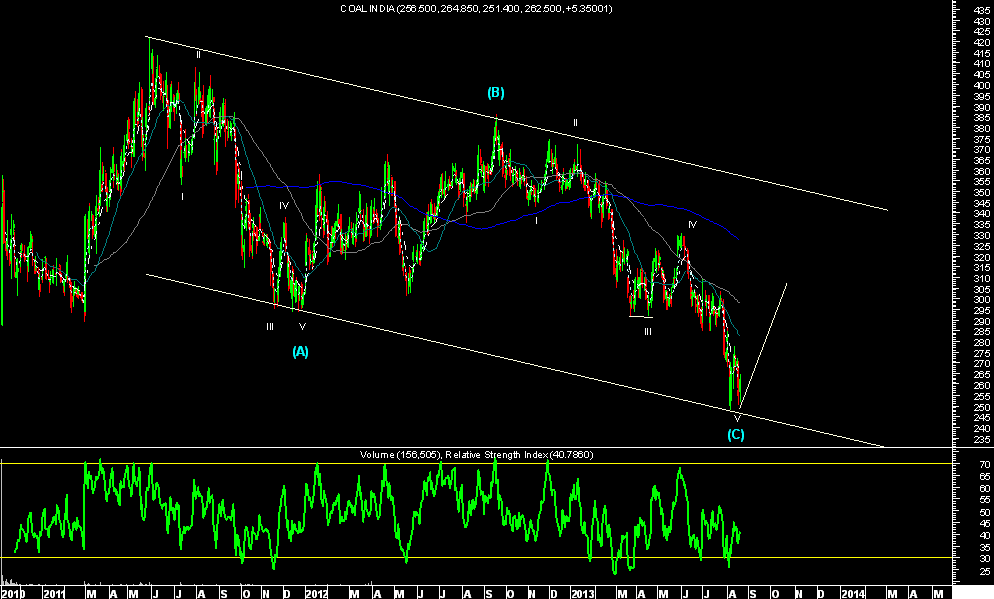
With the hammer on Daily chart and Positive Divergence on RSI some trend reversal looks round the corner. Though currently there is no evidence of reversal.. The Trend will change upon breakout of the falling channel.
Lets focus on some Interesting observations I have come across. In the above chart look at the comparison of the current fall to that of Early 2011. EW wise current fall form 6229-5118 looks like a larger corrective (w) similar to that of 6338-5178.. In 2011 wave 'b' inside (w) retraced 78.6% of wave 'a' and then 'c' almost retraced 161.8% of 'a'. Current fall looks similar with 'x' retracing 78.6% of w and 'y' almost done 161.8% of 'w'. So the larger degree (w) looks complete today and downside from here looks limited to 5023 which is exact 161.8% of 'w'.
The trend will change only upon breakout of the falling channel. And then Nifty may retrace this entire fall by 61.8-78.6% similar to that of 2011 in (x) wave.. There is no hard and fast rule as to how much (x) may retrace. But technically higher end f the larger channel shall be the tgt of this (x) wave. So upon reversal we may expect pullback upto 5800..
Thanks & Regards,
Harsh Dixit.
It has been a challenging Market for traders with daily Gap Ups 0r Gap Down in Nifty. The trend resumed down since late July. And there is no respite to Bulls. Earlier the Broad Market was slashing hard and later Index too started slashing harder. One question which everyone asking is "How much lower it will go?" In Bear Market nothing is too low. The Trend continues until there is a selling climax and the sentiments are extremely negative.
Currently sentiments are negative with lot of negative News from Domestic and Global front. Today morning Nifty witnessed a heavy sell off and next month Future Premium almost vanished during the sell off..
And now when market has dropped almost 1000 points in a month traders are expecting further downside to 4800. All these factors somewhat reflect the signs of Panic Bottom.
With the hammer on Daily chart and Positive Divergence on RSI some trend reversal looks round the corner. Though currently there is no evidence of reversal.. The Trend will change upon breakout of the falling channel.
 |
| NIFTY |
The trend will change only upon breakout of the falling channel. And then Nifty may retrace this entire fall by 61.8-78.6% similar to that of 2011 in (x) wave.. There is no hard and fast rule as to how much (x) may retrace. But technically higher end f the larger channel shall be the tgt of this (x) wave. So upon reversal we may expect pullback upto 5800..
Thanks & Regards,
Harsh Dixit.