17 September 2013

NIFTY - POWER OF ELLIOTT WAVE

Hi Friends,

In my last post around 5200 I mentioned about a Fierce Rally to 5800 and higher based on the observation of Elliott Wave Pattern and the implication of similar pattern in 2011. Within no time Nifty Rallied to 5957. It Almost retrace 78.6% of the Entire Fall from 6229-5118. So what next?

As mentioned in my last post this Fierce Rally seems to be a corrective Bear Market Rally. As per my preferred count Nifty seem to have completed (x) Wave at 5957. Now it shall resume the downtrend and may witness a Huge Sell off sub 5000 in next 2-3 months in (y) Wave.
NIFTY
Nifty has Trendline and Fibonacci Resistance at 5991 and upside if any looks limited. Current pattern is similar to 2011. RSI is showing Hidden Divergence which is early indication of possible Trend Reversal. In 2011 too Nifty Retraced around 78.6% of the previous Fall in (w) Wave and Developed Hidden Divergence on RSI around 4945 in April 2011. Later Nifty fell badly towards 4700 in (y) Wave till August 2011. So we may witness similar Sell off to 4700-4800 till end of December 2013.

In Short Term a Close below 5815-5795 will indicate a Trend Reversal. As per Wave Equality Nifty is expected to fall to 4845 by end of December 2013 considering the Top at 5957. In case of Wave Extension Nifty may witness Sell off to 4545 or 4420 or even lower.

Current view will be invalidated only if Nifty closes above 6060-6090. A close above 6060-6090 will change the short term view. Still in Long Term I would stick to my Bearish views for Market. The Broad Market has already topped out in Jan 2013. But the Index is not reflecting the true picture. Index is trading at Highs due to few heavy weight stocks which are comparatively trading at the Highs. But soon these stocks will start tumbling too. In a year ahead the Banks, I.T., FMCG & Heath-care stocks are expected to fall from 40-70%. Which will drag Index lower.

Thanks & Regards,

Harsh Dixit.

29 August 2013

NIFTY DEJA VU

Hi Friends,

It has been a challenging Market for traders with daily Gap Ups 0r Gap Down in Nifty. The trend resumed down since late July. And there is no respite to Bulls. Earlier the Broad Market was slashing hard and later Index too started slashing harder. One question which everyone asking is "How much lower it will go?" In Bear Market nothing is too low. The Trend continues until there is a selling climax and the sentiments are extremely negative.

Currently sentiments are negative with lot of negative News from Domestic and Global front. Today morning Nifty witnessed a heavy sell off and next month Future Premium almost vanished during the sell off..
And now when market has dropped almost 1000 points in a month traders are expecting further downside to 4800. All these factors somewhat reflect the signs of Panic Bottom.

With the hammer on Daily chart and Positive Divergence on RSI some trend reversal looks round the corner. Though currently there is no evidence of reversal.. The Trend will change upon breakout of the falling channel.


NIFTY
Lets focus on some Interesting observations I have come across. In the above chart look at the comparison of the current fall to that of Early 2011. EW wise current fall form 6229-5118 looks like a larger corrective (w) similar to that of 6338-5178.. In 2011 wave 'b' inside (w) retraced 78.6% of wave 'a' and then 'c' almost retraced 161.8% of 'a'. Current fall looks similar with 'x' retracing 78.6% of w and 'y' almost done 161.8% of 'w'. So the larger degree (w) looks complete today and downside from here looks limited to 5023 which is exact 161.8% of 'w'. 

The trend will change only upon breakout of the falling channel. And then Nifty may retrace this entire fall by 61.8-78.6% similar to that of 2011 in (x) wave.. There is no hard and fast rule as to how much (x) may retrace. But technically higher end f the larger channel shall be the tgt of this (x) wave. So upon reversal we may expect pullback upto 5800..


Thanks & Regards,

Harsh Dixit.

21 August 2013

EW ANALYSIS OF FEW STOCKS

Hi Friends,

Today, I'm posting my EW view on few stocks.

Axis Bank

A clear 5 wave in Wave 1/A seems over. As long as it holds 950 pullback in wave 2/B towards 1160 or 1250 on cards.

HDFC Bank

Corrective decline seems over. As long as it holds 560 a pullback towards 640 seems to be on cards..

HDFC LTD

Corrective decline seems over. As long as it holds 700 a pullback towards 800 seems to be on cards.

ICICI Bank

A clear 5 wave in Wave 1/A seems over. As long as it holds 790 pullback in wave 2/B towards 915 or 960 on cards.

IDFC

As long as it holds the channel support of 95 a pullback towards 115 or 120 seems to be on cards.

LIC Housing Finance

As long as it holds 150 a pullback towards 185 or 195 seems to be on cards.

ITC

The stock is consistently in uptrend. Correction in IVth wave seems over and as long as it holds 305 it might head up to 370-380 in Final Vth wave.

Infosys

Time to move out of I.T. stocks. Infosys still might have upside towards 3200. But post this Rally A huge decline to 2200 seems to be on cards.

HCL Tech.

Another stock which is consistently in Up Trend. The stock still may have upside to 1000. However any rally shall be used to exit longs.

Maruti

A 5 wave decline in wave 1/A seems over. As long as it holds 1250 a pullback upto 1425-1460 seems to be on cards.

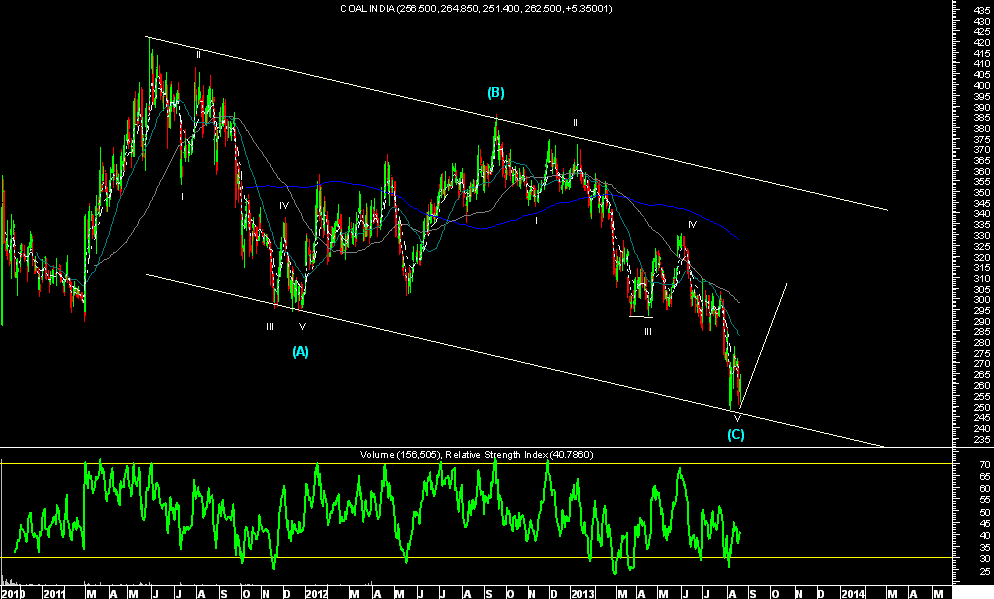
Coal India

A larger Corrective decline seems over. As long as the stock hold channel support of 245 a huge bounce upto 310 or 330 seems to be on cards.

DLF


A Clear 5 wave decline from 290-120. As long as it holds 139 pullback to 175-185 seems to be on cards.

JP Associates

Extended 3rd wave seems over. A pullback in 4th wave to 41 seems to be on cards.

Jindal Steel

Extended 3rd wave seems over. A pullback in 4th wave to 260 or 290 seems to be on cards.

Tata Steel

Another Metal Sector stock in Bear grip. Currently seems to be in 'B' of Y.. A relief rally towards 290-325 seems to be on cards.


Thanks & Regards,

Harsh Dixit.