10 December 2012

NIFTY - TIME TO BE CAUTIOUS

Hi Friends,

In last post I mentioned about the Year End Rally to 5950-6040. Well we achieved 5950 much before expected time. So here it is time to Book 80-90% of the Longs.

As per my preferred count this entire 2012 Rally is just a Corrective Pull Back of 2011 Fall. Currently move form 4531 can be labeled only as a 3 Wave Corrective Pull Back. So this marks for a Wave (b) of a zigzag. 


NIFTY _ Daily

On a Daily Chart we can Clearly see a 5 Wave Rally from June low of 4770. Currently Nifty is in 5th Wave which might have been over at 5950. RSI Negative Divergence in 3rd & 5th is a reason to be cautious. Also Nifty has Retraced up-to 78.6% of 2011 Fall. So Bulls must be extremely careful at current level.

Lets look at some calculation where this 5th Wave can Terminate.

1. Wave 1 - 4770-5348 = 578. 5548+578 = 6126
2. Wave 1-3 - 4770-5815 = 1045
a. 1045*0.382+5548 = 5948 (Already Done)
b. 1045*0.618+5548 = 6194

Nifty has already achieved 0.786 of 2011 Fall or 0.382 of net Distance Traveled by Wave 1 & 3 within 'c' of (b). Hence, Bulls need to be extremely careful at current level.


NIFTY - Hourly

On a Daily Chart Thursday's Candle Marks for Hanging Man & Friday's has a Black Candle. So this could turn out to be a point of Trend Reversal. However, on Hourly Chart Friday's Fall appears to be a Correction of the Thursday's Sharp Rally in 2nd Half. So (V)th inside 5th of 'c' might be Extending. So until we don't see a Sharp Cut on Nifty Below 5839 Trend will Remain Up.

Since this is the Final Leg of the Rally, there is high probability of (V)th Extension. 5th Waves often Truncate or Extend. Since Nifty has crossed 5815 there is no case for Truncation. Hence, in my sense this 5th Wave might go beyond Bulls' Imagination & Eradicate all Bears from the System.

In case of Extension my target above 5950 would be 6068-6126-6147-6194. However, any further Rally must be used to Exit Longs, as 5th Extension is an Indication of Dramatic Reversal Ahead.

In Case Nifty starts Drifting Lower, 5750 & 5650 are Imp. Supports. Failure to hold 5650 (Channel Support) would have a much Bearish Implications. If Channel Breaks there is likelihood of Sharp Fall till 5090.


So lets wait & watch..

Thanks & Regards,

Harsh Dixit.

19 November 2012

THE BEGINNING OF THE END

Hi Friends,

Since the beginning of 2012 I had been talking about the forthcoming Crash in U.S. Equities & now  it seems like the so called most awaited Mayhem has Started. Today I'm posting the Real Long term Picture of Dow Jones Industrial Average & thesis behind the so called Crash.

History Of Dow Jones & Super Cycle:-
Source:- http://www.elliottwave.com/

The above chart by EWI shows the Super Cycle of DJIA & History of Presidential Election. So far only 1 Incumbent had been Re-elected during Major Bear Market Rallies in DJIA. Obama is the 2nd Incumbent who is Re-elected. The EWI Research shows that the Incumbent has more chance of getting re-elected during who's Tenure Stock Market Rallied. So Obama's Re-election was an expected outcome. However, the main point here is Investors must not forget the History. Dow History shows that all Major Bear Market Rallies witnessed the Bust in later period.

A Complex Corrective Rally:-
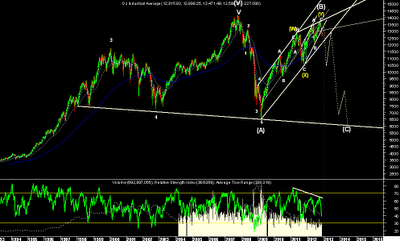
DJIA - Weekly

On a Weekly chart we can clearly see a 5 Wave Decline from 2008 Top which could be marked  as either Wave A or 1. And the 43 months Rally from 2009 lows is a clear Complex Corrective. This Rally doesn't satisfy a single Criteria for Directional Move. The Waves are overlapping & there is no Faster Retracement of 2008 Fall. Hence, the Rally is but obvious Corrective in Nature. We can also see momentum loosing which is evident from Huge RSI Negative Divergence & Decline in Volumes.

Short Term Picture:-
DJIA - Daily

On Daily Chart we can now see a clear Impulsive Fall from Oct High. The Market is oversold & hence a bounce back in wave (iv) is expected. Major support is around 12120 where I expect Wave 1 to complete. The Year End Rally in Corrective Wave 2 up shall be used to Exit Longs.  

Alternatively there could be another (X) & (Z) Waves & DJIA may make a New High. However, Investors must use the Year End Rally to Exit Longs. As much larger Crash is expected in 2013. 

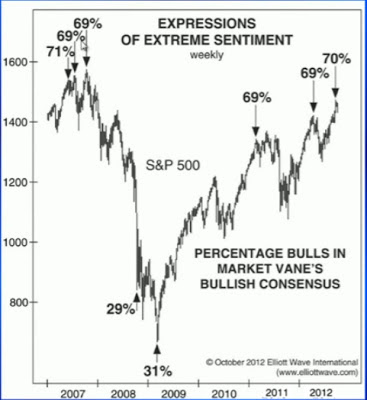
Sentiment Indicator:-
Source:- http://www.elliottwave.com/

The above chart shows the % of Bulls in Market. And as usual the consensus depicts the extreme expression of optimism right at Top. Which has extremely Bearish implications as suggested by the History.
Source:- http://www.elliottwave.com/

The Comparison of CBOE VIX & S&P 500 is another Indicator that seeks attention. The low VIX readings have much Bearish implications on Indices. The mild push in VIX suggest that Investors have not yet Panicked by current fall & thinking this is just a Correction in Ongoing Bull Market. The current picture is reminiscent of what happened in early 2008. The above 2 charts give early warning to Investors of a forthcoming Crash.

Mutual Fund Cash Levels:-
U.S. Mutual Fund Cash Levels vs. S&P 500

The Stock Market needs Cash to Fuel a Rally. The above chart shows Mutual Fund Cash Levels vs. the S&P 500 from 1968. The History shows that Stock Market Rallied when Mutual Fund Cash Levels were at Record Highs & Sold off when Cash Levels were at Record Lows.

Cash levels have been in a range of 3.4% - 3.8% since July 2010 as Stock prices have continued to Rise. This is quite different from prior history and is evidence of the Fed propping up the Market. This cannot continue indefinitely & Market is facing a long decline similar to 2000-2002 and 2007-2009 (40-60%).

In short we must listen to the signals given by Market and don't presume that Government Agencies will Protect our Finances.


Thanks & Regards,

Harsh Dixit.

16 November 2012

NIFTY - SETTING BASE FOR YEAR END RALLY

Hi Friends,


NIFTY

In last post I had mentioned about Diwali Rally to 6040. Though Nifty initially broke above the consolidation channel, it could not sustain & fell back sharply. So Nifty is still in 4th Wave which might get over in a day or two.

As suggested by EWT Corrective Waves generally take more time than Motives. Wave 3 Took 20 Days. Hence, Wave 4 shall consume more than 20 Days. Wave 4 has so far consumed 28 Days. And it might consume 1 or 2 days more to complete.

Wave 2 was Running Correction & Wave 4 looks to be a Flat. Wave 2 Retraced up-to 50% which is a Deep Correction. Hence, Wave 4 shall be a Shallow Correction & Retrace up-to 38.2%. A Flat represents a Shallow Correction. More of Time wise Correction than Price. And often witnessed in Wave 4.

Nifty has Strong Rising Channel Support near 5575 & 38.2% Retracement of Wave 3 is at 5585. Hence, Nifty is likely to hold this Support & Ride Higher in 5th Wave to 5944-5976-6040 till Dec last week.

This view will hold true until Channel Support is held. If Channel Breaks I would look for some alternate Count.

Currently I remain Bullish for Year End Rally. This Rally might be the last Run up on Nifty & try to Trap most of the Long Term Investors by heading beyond their Imagination. But Investors must use this Rally to Exit Longs.

Banking, Capital Goods & Metal Sectors will Outperform this Rally. Auto may remain Sideways to Bullish. FMCG & Pharma Sectors seem to have already made a Cycle Top & will give only Corrective Bounce.


So lets wait & watch..


Thanks & regards


Harsh Dixit.

7 November 2012

CIPLA - ELLIOTT WAVE UPDATE

Hi Friends,

Today CIPLA touched All Time High 398 after reporting Better than Expected Q2 Earnings. However, I believe this Depicts the stage of Euphoria & marks for the point of Maximum Financial Risk but also Maximum Financial Gain.


CIPLA - Daily

In last post I mentioned about CIPLA Top near 396 in Vth Wave of (c) of Irregular Flat B Wave. Though initially CIPLA dropped till 352 very fast with Current move its clear that Top in Vth might still be pending. There is little shifting of Wave labels. However, main view still remains the same. The view for Irregular Flat B Wave will be Invalidate only in case the stock moves beyond 415.

On a Daily chart we can now clearly see a 5 Wave Rally from Wave (b) low of 286. Today's Candle marks for a Hanging Man which could turn out to be a Bearish Reversal Pattern. We can also see RSI Negative Divergence & Huge Volume with Today's Candle. So Bulls need to be Extremely Careful here.


CIPLA - Hourly

On Hourly Chart we can see that Stock is moving in a Steep Upward Rising Channel. The Trend will remain Up until this Channel is held. However, RSI Negative Divergence Indicates that possible Trend Change on Cards. Stock has achieved both Wave (I=V) target & also Triangle Breakout Target Today. A close below Hourly Trend Channel would Indicate The Short Term Trend Change and Close Below Wave 2-4 line would be initial Indication for a Major Trend Change. Faster Retracement Below 352 will confirm the Huge Drop in Stock.


So lets wait & watch..


Thanks  & Regards,


Harsh Dixit


2 November 2012

NIFTY ROCKET MIGHT BE READY FOR MISSION 6040

Hi Friends,


NIFTY - Weekly

In last post I mentioned about 4th Wave Decline on Nifty to 5525. However, after assessing current structure it looks like the Correction in Wave 4 might have already been over at 5583.


NIFTY - Daily

Nifty has been Rallying in a Channel since June 2012 low of 4770 & Trend will Remain Up until this channel holds. On a daily chart we can see a clear 3 Wave decline. Nifty took support at 38.2% Retracement of the September Rally. Hence Wave 4 as discussed might have been over. and Nifty might have started its journey towards 5950-6040 in Wave 5.


NIFTY - Intra Day

On Intra-day chart we can see the Triangle in Wave B which is which is quite common for B Wave. However, it's still not clear whether C is over; as there is no clear evidence for  5 Wave decline n C of Wave 4. Also Rally from 5583 is not clearly identified as Impulse. And it does look like Wave 4 Corrective. So still there is slight chance of Nifty sliding lower in final 5th Wave to complete 20 Days Cycle. Since Wave 3 consumed 20 Days Wave 4 Corrective shall also consume 20 Days. So this decline may fall short and does not go below 5585.

So further Dip if any shall be bought with stop below 5515 to ride the Rocket Rally to 5950-6040. Since this is the 5th wave its Better to keep a Trailing Stop until Nifty reaches 5950-6040 to Enjoy the Rally..

The above view shall hold true until Nifty takes support of Rising Channel. However, if Channel break all Hell will Break Free till 5060. Also since Nifty has already achieved Wave equality in Larger Degree 'C' at 5815 there is possibility of 5th Failure. So we need to be cautiously & not aggressively Bullish here.


Thanks & Regards,

Harsh Dixit.

29 October 2012

DJIA AT MAKE OR BREAK

Hi Friends,


DJIA - Daily

Its been long since we have posted something on Dow Jones Industrial Average which is one of the most tracked Indices in the World. But currently it's at a Make or Break Point. 

DJIA - Hourly

DJIA has been moving up in a Channel since Oct. 2011 lows & taking support at lower boundary line. Currently it has a strong Support near 12970-13030 which if held DJIA may further Rally to New High to 13750-13800 till Mid Nov. On Daily Chart it's Oversold & on Hourly Chart it is showing a positive RSI Divergence. So a Bounce from current level is very likely, but Traders shall look for Faster Retracement of the Falling Segment as confirmation for Rally towards New High.

DJIA - Weekly

On a weekly chart also DJIA has been moving up in a Chanel since March 2009 lows. It's a 42 months long Recovery Cycle which is Maturing. While, most of Analysts, Financial Magazines & Investment Bankers are Calling this as a Long Lasting Bull Market; we still believe that it's just a Bear Market Rally Which is Driven by Easy Credit through QE's. And this Credit Bubble will Burst soon. Therefore,  if DJIA manages to hold this Support & Rallies to New High; Investors shall use this Rally to Liquidate their Longs.

We will post more on Long Term Cycle on DJIA & How today's Investor Sentiments Depicts Start of Yet Another Forthcoming Stock Market Crash in our next post.


So lets wait & watch..


Thanks & Regards,

Harsh Dixit.
7 October 2012

CIPLA - ELLIOTT WAVE UPDATE

Hi Friends,
CIPLA

In our last post we mentioned that CIPLA seem to have started its Down move in 'C' leg of Flat in Cycle Degree Wave 4. Of which Wave (i) seem to have over at 353. We mentioned that Wave (ii) might retrace up-to 78.6% to 387. CIPLA exactly retraced up-to 387 and started Tumbling Down.

On completion of Wave (ii) we posted a comment that Faster Retracement of this Corrective Rally  would help us to conclude that Wave (iii) down has started. CIPLA has Retraced more than 50% of this Corrective Rally in Wave (ii) up in less than 50% of time. Further, on hourly chart we can clearly see Impulse move down sub-dividing. So this satisfies the criteria for Directional move in Wave (iii) down. Following pure Elliott Rule, Wave (iii) can Extend up-to 1.618% of Wave (i) to 317 or 2.618% to 274.

The Current move may take a pause at 350-352 area & Retrace back to 368-370. Investors still have chance to Exit Longs before Wave (iii) starts accelerating. As a trader I would wait for a Corrective Pullback Rally to initiate Short Trade. And would not suggest to Buy this stock until Wave (iii) gets over. Since Wave (iii) is Fastest and Longest, Bulls must stay away from this stock.


Thanks & Regards,

Harsh Dixit.

INFOSYS - ELLIOTT WAVE UPDATE

Hi Friends,


INFOSYS
INFOSYS

In our last post we mentioned that INFOSYS seems to be in Wave 2 of (C) of the Cycle Degree Wave 2, which might develop as Zigzag Correction. The correction seems over at 2648 and it might have started moving in its 3rd Wave down. Generally Zigzags are Bounded by Channels. So until the stock doesn't break above this Channel our assumption of wave 2 holds true. There could be a Double or Triple Zigzag & stock may try to fill the Gap at 2740. But owning this stock as an Investor is still bit Risky. 

This is not a Short Call on the Stock. But an alert for Investors to exit Longs. For Short confirmation traders mus wait for break down from the rising channel. As a trader I would wait patiently till the stock breaks down from the Rising Channel an initiate Short trade on a pullback.


So lets wait & watch..

Thanks & Regards,

Harsh Dixit.

3 October 2012

NIFTY AT INFLECTION POINT

Hi Friends,

Yesterday I wrote about 5th Extension within 'c' of 3rd on Nifty. However, after carefully observing the charts, we have now two possibilities on Nifty.
NIFTY- 5th EXTENSION IMPULSE

1. As per the yesterday's post 5th within 'c' of 3rd might be developing as Extension Impulse Wave. Break above 5756-5780 will confirm the target of 5944-6040 in this case. 
NIFTY- ENDING DIAGONAL IN 'C'

2. The entire formation from low of 5215 might be developing as an Ending Diagonal. Ending Diagonal generally develops in 5th or C wave.. So Break below 5691 will be initial sign of weakness and below 5639 we will get confirmation for 5520-5440.

So at this crucial juncture Bulls must keep strict stop-loss of 5639 and wait for break above 5756-5780 to Ride further Up Move. And Bears must wait for break below 5691 and confirmation below 5639. Once 5639 breaks Bears can take a short trade on corrective pull back for target of 5520-5440.

Since, momentum is loosing as seen from RSI Negative Divergence formation discussed in 2nd is more probable.

So lets wait & watch..

Thanks & Regards,

Harsh Dixit.
NIFTY - EXTENDED 3RD WAVE

Hi Friends,
NIFTY

In our last post we mentioned to be cautious around 5738-5756. As per previous post we were expecting this Rally in 3rd wave to End around 5738-5756. And were waiting for the missing (v)th of 5th wave to to take short trade. But after the Friday's action it seems that 5th wave under this 3rd wave is developing as an extension impulse and can shoot up to 5932 or even 6040 till Oct 24th. Sustained move above the trend channel around 5780 will confirm that 5th wave is developing as an extension impulse and will also confirm that its the Extended 3rd wave on Nifty.

Generally 3rd wave is the fastest and longest among wave 1-3-5. Similar kind of move was witnessed in Jan 2012 where Bears got completely wiped out in 3rd wave of the wave 'A' of this corrective up move. There are lots of shorts active in the system and Nifty will keep moving higher until all these shorts are totally wiped out.

Experts say that never try to predict the end of 3rd wave. So it is better to keep trailing the protective stops to ride this up move.


Thanks & Regards,

Harsh Dixit.

23 September 2012

NIFTY- TIME TO BE CAUTIOUS

Hi Friends,


NIFTY-DAILY

In our last post we wrote about the target of 5686-5738 in 'c' leg of Wave 3 of the Ending Diagonal on Nifty. Nifty touched 5720 & with this 10% Rally of Sept. is almost done. 

http://trend-o-nomics.blogspot.in/2012/09/nifty-ready-to-zoom.html

So now we suggest everyone to Book Longs on Nifty. As expected Auto, Banks & Metal stocks outperformed in this Rally & Pharma & FMCG Stocks under-performed. All thanks to wisdom of the great R.N. Elliott who discovered the amazing theory of Wave Principle.


NIFTY-HOURLY

On a Daily chart we can clearly see the 5 wave move complete from 5215-5720. We can also see a clear RSI Negative Divergence within 3rd and 5th wave on Hourly chart. Further, on Hourly chart we can see that (v)th of the 5th wave is still missing. So we expect the move towards 5738-5756 in (v)th of the 5th wave on Monday 24th Sept. Once Nifty completes this missing (v)th wave, it will grind lower to 5434 in its 4th wave of the Ending Diagonal in next 10-12 trading sessions.


So lets wait & watch..


Thanks & Regards,

Harsh Dixit.

18 September 2012

CIPLA ELLIOTT WAVE - UPDATE

Hi friends,


CIPLA

In our last post we mentioned about final top in CIPLA near 380 in 5th wave of (c) of Flat in 'B'. The Stock went little above that to 396 to reach its final top in 5th wave of (c) of Flat 'B'. Since it breached above the 380 mark i.e. beyond start of Wave 'A' its surely the case of an Expanded Flat Correction where Wave B often extends beyond start of Wave 'A'. So a minimum 100 points drop is expected in Wave 'C' of Cycle degree Wave 4.. C of Flat is always an Impulse. So an impulsive fall will confirm this wave count.

CIPLA HOURLY

On short term though we still havent got confirmation for 'C' of Flat a clear 5 wave Rally from low of 300-396 is visible. Further, an Ending Diagonal in 5th confirms that Uptrend in Stock is over. We can also see a clear RSI Negative Divergence on hourly chart between wave (iii) & (v). Breach of (ii-iv) line further confirms that Uptrend is over. Further, we can see a clear 5 wave decline from top of 396-357.. I have marked this as wave (i).. And now the stock may correct this fall up-to min 61.8% Retracement to 380 or max 78.6% to 387.. Wave (ii) may take shape of Flat, Traingle, Zigzag or Combination and take more time than wave (i). Wave (ii) generally retraces the most. This is not a buy call but an opportunity for Investors to exit the stock.


Thanks & Regards,

Harsh Dixit.

5 September 2012

NIFTY READY TO ZOOM

Hi Friends,

In our last post we were talking about possible Ending Diagonal in Nifty. And it seems like its actually playing out. Though we were looking for Reversal at 5312, we mentioned about more downside to 5215-5245 Gap Area.


NIFTY

With today's low that dip seems over. And 'b' leg of the 3rd Wave looks to be Complex Correction or Diagonal completed at 5233. So Nifty might move in its 'c' leg towards 5610-5686 or higher.

On short term basis 5341-5368 is on cards. Will review there whether 1 more dip to 5221-5202 coming.. However, break above 5401 & 5448 will confirm upside to 5610-5686-5738.. Sept month is generally Bullish and with current set up 10% move is visible on Nifty. Auto, Banks & Metals will lead this Rally. Pharma & FMCG the Star Performers so far will Under-Perform in this Rally.. Trade wisely..


Thanks & Regards,

Harsh Dixit.


29 August 2012

NIFTY POSSIBLE ENDING DIAGONAL

Hi Friends,

Ever since Nifty made its Low at 4770 on 4th June we have been mentioning that it is in its C leg of the Minor Degree Wave B Up. And till date its moving as per or projected path. Earlier we were thinking it to develop as Impulse. However, after the 1st leg was over at 5348 we realized that C might be developing as an Ending Diagonal a Terminal Structure. And Ending Diagonal would rather confirm that Nifty is indeed moving in C of B up. Well as of now we still don't have sufficient evidence for Ending Diagonal. But Once Nifty Completes the 3rd leg we will have that confirmation.


NIFTY-ENDING DIAGONAL

Currently Nifty looks to be in 3rd leg of the Ending Diagonal. Of which 'a' looks complete at 5449. We can clearly see a 5 Wave Rally from 5032-5449. What may follow is a 3 Wave Decline in 'b' leg from 5449 top of 'a'. Well this 'b' looks complete at 5312 today's low; as Hourly Charts show a Positive Divergence in RSI and the Fall also satisfies Kennedy's Channeling Techniques Rules. So Nifty may Head up from here in its 'c' leg of the 3rd Wave of Diagonal. However, one shall wait for confirmation by channel breakout above 5360. And also keep room for some more decline to 5289 a 38.2% Retracement of 'a' leg or Gap Area at 5245.

On pure Elliott basis a=c gives target of 5728 for the 3rd leg of the Diagonal. However, 'c' may Fall Short and achieve only 5610 or 5686. In best circumstances Nifty may go as High as 5932 in its 5th leg of the Diagonal till 5th Nov. However, we are betting for a conservative target of 5738 for the Diagonal.

The above view will hold true only in case Nifty holds above 5221. Else we would look for alternate Wave Count of Triangle in B.


So lets wait & watch..

Thanks & Regards,

Harsh Dixit.

26 August 2012

INFOSYS ELLIOTT WAVE ANALYSIS - A LARGE FRACTAL

Hi Friends,


INFY-MONTHLY

This is the Monthly Chart of Infosys Ltd. We can clearly see the 5 Wave Bull Market Advance from 1993-94 to 2011. INFY Completed its Cycle Degree Wave 1 in Jan-2011.  We can clearly see the Declining Volume & RSI Negative Divergence Indicating End of Bull Market in Stock at 2011 High. And now the stock is Correcting this entire Advance in its Cycle Degree Wave 2 which can take the stock down to 1000 or even lower as per pure EW Guidelines.


INFY-WEEKLY

On a weekly Chart we can clearly see that prices have Fallen Below the Trend Channel of Circled Wave 5. Indicating that Cycle Degree Corrective Wave 2 is ongoing. One may argue that a 3 Wave Decline is complete at 2100 in July 2012. However, considering the Monthly Chart & Long Term Cycle the Price Pattern Implications & Price Objectives are not yet met with. So this Stock is not yet a Safe Buy for Long Term Investment.


INFY-DAILY

However, short term traders can play for possible short term moves. On Daily Chart it looks to be in its 'a' wave of the 2nd of (C) Wave of Cycle Degree 2. This 'a' may get arrested at 2540-2550. So one may like to Short this Stock after clear 5 Wave advance for 'b' of 2nd or wait for clear 3 Wave decline form the top of 'a' and play for next 5 Wave advance in 'c' of 2nd Wave up.

We would Prefer to Play for next 3rd Wave down which will be Sharpe Decline.


So lets wait & watch.


Thanks & Regards,

Harsh Dixit.

22 August 2012

CIPLA ELLIOTT WAVE

Hi Friends,

It is very interesting to see when Market is distributing different stocks at different time. Time Cycle wise Pharma stocks are the Late Movers in Market & generally form Right Shoulder of the Market Head & Shoulder.


CIPLA

Current advance on CIPLA looks to be nothing but a corrective advance in (c) leg of the 'B' of Flat. CIPLA currently looks to be in Cycle Degree 4th Wave Corrective which is a large Fractal & might be developing as Flat Corrective.

A 3 wave move from 380-275 is marked as 'A' leg & Currently its moving in another 3 wave move up in 'B' leg. The 5th of (c) shall take some more time till mid Sept. to reach 370-380 area. Once 'B' leg is over the Stock may start drifting lower in its 'C' leg of Flat towards 275-250.

Currently we are examining this preferred Count of Flat in 4th Wave. In case of Flat C shall be a Clear 5 Wave Move Down & may take lesser time than A & B. However, we would consider the alternative of Zigzag as CIPLA starts Drifting lower towards 275 & internal legs unfold.


So strategy for Investors is to exit the longs as stock moves up.


Thanks & Regards,

Harsh Dixit.

19 August 2012

NIFTY WEEKEND ANALYSIS

Hi Friends,

In our last post we were examining the possibility of two alternate wave counts:-
1. Zigzag in B
2. Triangle in B

Since the move from 5032 to 5400 is clear 5 wave Rally possibility of Triangle is now being ruled out.

So Nifty might be forming a Zigzag in "B" of which 'A' was over at 5499 & 'B' at 4770. Currently Nifty is in 'C' leg which might be developing as an Ending Diagonal.


NIFTY

The Rally from 5032-5400 looks to be 'a' leg of the 'C' of Ending Diagonal a Five-3 Structure.
Nifty is just closing on the edge of this Rising Channel. All longs now need to be liquidated. And a possible trade here is to remain short with stop of 5400. Fresh longs need to taken only above 5400 or after meaningful correction.

Nifty might now trade within the range of 5300-5400 for 3-4 days just like it remained Range-Bound in June after completing 'a' leg of the 'A' of Ending Diagonal.

The immediate support is placed at 5320-5330 below which Nifty may grind lower to 5289-5260. At most it may try to fill the Gap at 5246. But we still believe in a Range-Bound Price Action a Time wise Correction than much of a Price Damage..


So lets Wait & watch..

Thanks & Regards,

Harsh Dixit.

13 August 2012

TIME TO BE CAUTIOUS

Hi Friends,

In our last update we projected this move towards 5650. So far Nifty has been moving nicely in a Up Trend Channel. We almost captured a nice 300+ points move from 5040 levels. Now its time to be little cautious.

One thing is now confirmed that we are actually in 'B' leg up of the larger Zigzag Corrective in major "C" which started in Nov. 2010. Of which 'A' leg was a Leading Diagonal or Complex Corrective. By Elliott Wave logic 'B' can either be Zigzag, Flat, Triangle or Combination. Looking at the current structure possibility of Flat is ruled out.

So there are now tow alternatives coming up:-


NIFTY - ZIGZAG

1. As per our preferred Count Nifty is in C leg of 'B' leg up which is developing as Zigzag. Though we were initially thinking C to develop as an Impulse the internal structure is not clearly Impulsive within 1st leg up. So C might be developing as an Ending Diagonal. Where all 5 legs are 3 legged structure. So it would be Aproriate to take June-July Rally as A leg & the move towards 5032 as B leg of the Diagonal. Currently Nifty is in C leg which could reach up to 5610 or higher. But for this we need confirmation above 5378 and then above 5481..


NIFTY - TRIANGLE

2. As per the next best alternative 'B' leg might be developing as a Triangle where all 5 legs are 3 legged structure. As per this alternative Nifty is in D leg of the Triangle which is developing as an Expanded Flat. A move below 5286 & further below 5261 can take Nifty to 5060 or lower to 4980 in D leg of the Triangle. Since the move in last 2 days is not clear Impulse Nifty can retest 5378 area before sliding down.

We are still going with our preferred Count and aiming for 5600+ for 3rd leg of the C of B in Zigzag. But we are cautious and all longs are to be kept with stop loss of 5280-5290.. We would go short below 5280 & add  more below 5260..


So lets wait & watch..

Thanks & Regards,

Harsh Dixit.

26 July 2012

IS NIFTY HEADING TO 5654?

Hi Friends,


Nifty has been correcting ever since it reached our target of 5345 on July 10th. 
NIFTY

The Current Fall appears to be non-directional move. As per a=c exact target of 5076 is done for wave 2 & this correction seems over at today's low.


Its too early too conclude that wave 2 has ended today. The Confirmation for start of 3rd wave will be above 5221 & most importantly above 5301. A Faster Retracement of the Falling Segment would confirm the start of wave 3. So if Nifty manages to cross 5301 in next 4-5 trading session we can expect a move towards 5654 with minor hurdles at 5378 & 5481. 
NIFTY

As per our preferred count :-


Wave 1 = 4770.35-5348.55 = 578.20 points (4th June - 10th July = 36 Days)


Wave 2 = 5348.55-5076.60 = 271.95 points (10th July - 25th July = 15 Days)


Wave 3 = 5076.60 + 578.20 = 5654.80 


In case of time Equality Wave 3 shall be reached till 30th August. While in case of overshoot in 3rd it maybe reached in 0.618 time i.e. till 16th August.


The Above view will hold true till nifty hold 5094 & most importantly 5015. Below 5015 we will be forced to end the 'C' of one larger Degree B at 5348.55. (Case of C Failure). In this case we believe that Nifty will break below yearly lows.


But as of Now we are Bullish as Currencies also Suggesting big Jump in EUR/USD to 1.29 & Correction in Dollar Index to 81.25 & USD/INR to 52.90.


So lets wait & watch.


Thanks & Regards,


Harsh Dixit.

15 July 2012

NIFTY WEEKEND ANALYSIS

Hi Friends,


In the last post we were thinking about Nifty top around 5334. Well the question still remains unanswered. Nifty has till now managed to hold the Support of 5221. And the recent Down Move looks to be the Flat Correction.


NIFTY

1. As per our 1st alternative Nifty might have Topped Out at Wednesday's High of 5336.


2. Or as per 2nd alternative it has still further room to go to either 5481 or to 5738.


a. The current down move might be the Expanded Flat Correction in wave 4.  or


b. It might be Flat Correction in Wave (ii) of Extended 3rd Wave.


In Case of (a) the 5th would Terminate at 5481. And in case of (b) Wave 3 might extend till 5651 & 5th may reach our expected target of 5738.


So now a move above 5286-5334 might take Nifty towards 5481 where we would like to review the next course of action. Or A move below 5196 can take Nifty Down to 5051.


As of now we are still Bullish & aiming for minimum target of 5481.


So lets wait & watch..


Thanks & Regards,


Harsh Dixit.

9 July 2012

HAS NIFTY TOPPED OUT?

Hi Friends,


While Most of the Analyst believe that India is back in Bull. We still believe that its not the Bull Market but just Bear Market Rally. But has this Rally Fizzled out?


Well the Corrective Advances all over the Globe seems over and the Major Equity Indices across the Globe including  CAC, DAX, FTSE, DJIA & SPX are ready Tumble from the Sky.


But its still difficult to say whether Nifty has already Topped out?  It is not easy to catch each & every top & bottom. So now 1 must be ready to act as Nifty unfolds.
NIFTY


1. As per our 1st alternate we were looking for 5385-5435 as the termination point for this Rally but as the case may be now it looks like failure of 'c' of B. So the 5th within 'c' of B might have truncated at 5333. Or there might be some up stream left till 5344..
NIFTY

2. As per our 2nd alternative the Rally might continue & cross previous top at 5630 to Trap the Bulls. In This case we would look at 5738 as the termination point for this rally.


But as the Global Counterpart Indices are looking vulnerable and ready to tumble from the Sky the 2nd alternative looks little difficult.


So now the key is to Ride the Train whichever way it takes Turn.. Above 5344 there is still some room for 5385-5435. But Below 5286 its straight decline to 5221 & below that Nifty might Slide to 5184-5148..


But the key for Direction of the Major Trend is in two alternative nos 5145-5435. Weekly closing above 5435 would indicate a New High on Nifty while Weekly closing below 5145 would be indication of New Low on Nifty.


So lets wait & watch..


Thanks & Regards,


Harsh Dixit.

2 July 2012

NIFTY ROCKET FINALLY KICK STARTED

Hi Friends,


After Consolidating for almost 10 trading session Nifty Finally Broke out of the Triangular Corrective pattern on this Friday. For others this move might have came as surprise but we had already posted our view for this upward break in last week.


http://trend-o-nomics.blogspot.in/2012/06/nifty-ready-to-fly-sky-high_24.html


Currently there is no change in the view and we are still going with the two alternative.


1. Looking for 5385-5435 as the Initial Hurdle for this Rally to Fizzle out in B of TZZ of the Complex Corrective which started in Nov 2010.

NIFTY


2. The Rally to Continue & Cross Previous Top at 5630 to Trap the Bulls. In this case we would look at 5738 as the Termination Point for this Rally in 'c' leg of the B of C of Zigzag. But we might keep the options open for 'c' Extension or Failure.


Currently the 2nd alternative of 5738 looks more likely.


Currently Nifty might come down in an attempt to Fill the Gap created on Friday. Which is still unlikely in our view as 5221 holds Strong Support & any dip would be good Buying Opportunity for a target of 5385-5435.


So lets wait & watch..


Thanks & Regards,


Harsh Dixit.

24 June 2012

NIFTY READY TO FLY SKY HIGH

Hi Friends,


After this Roller Coaster Ride for about 7 Trading Sessions as expected Nifty is again ready to Fly Sky High.


As per our earlier view Nifty completed its 1st leg of Rally at 5124. But later we shifted it towards 5145as that's the only best alternative available. And then Nifty started correcting the Gains in a Roller Coaster Ride as was posted here.


http://trend-o-nomics.blogspot.in/2012/06/nifty-roller-coaster-week-ahead.html


Currently we have 2 alternate Wave Counts.
NIFTY


1. Nifty might still be in its B leg of the Final C of TZZ the Complex Corrective which started in Nov 2010.
After the initial leg 'a' which terminated at 5145 Gaining almost 375 points over 8 Trading Sessions, Nifty started Correcting the Gains in a triangle in 'b' leg which might have been over at 5094. And now it might have started moving upwards in its 'c' leg towards 5365-5435.
NIFTY


2. Nifty might have completed its Complex Correction in Wave A at 5431 & now heading up in its B leg towards 5738-5842. 'a=c' gives minimum target of 5738. But we might keep the options open for 'c' Extension or Failure as the Market Unfolds its legs.


Both the above said views are subject to holding of Friday's Low of 5094 & most importantly 5040. And if this Rally Kick Starts from Monday breaking 5184, no one will be able to Turn Nifty Down before 6th July.


So lets Wait & Watch..


Thanks & Regards,


Harsh Dixit

17 June 2012

NIFTY WEEKEND ANALYSIS

Hi Friends,


There is lot of Curiosity & Confusion about the Greece Election & RBI Policy on Monday.
But with Help of Elliott Wave Principle nothing to worry about the future Direction of Market.
NIFTY
As per our Preferred Count Nifty has Completed its Wave 'a' & 'b' of major B and now it might have started its  upward move towards 5345-5365 in wave 'c'.


Still one must wait till break above 5165. The Correction in wave 'b' may or may not be over yet. I'm keeping the option of Flat correction in wave 'b' open. In that case maximum correction till 4965 can be expected. But this dip would be good buying opportunity for higher targets of 5345-5365. In case Nifty breaks above 5165 before any correction the possibility of Flat will be completely ruled out.


Currently we are looking towards the target of 5345-5365 but cannot rule out wave extension to 5435 also. As per our alternate Count we are looking for a target above previous top of 5630.


So lets wait & watch.


Thanks & Regards,


Harsh Dixit.

11 June 2012

NIFTY - ROLLER COASTER WEEK AHEAD

Hi Friends,


After this super 300+ points move in just 1 Trading Week, Nifty is likely to take its participants for a Roller Coaster Ride In this Coming Week. 
NIFTY
As per our preferred Wave Count, Current up-move may get arrested at 5124-5136 and Nifty may start Retracing the Gains of this Rally. Once this Clear Impulse move in 'a' leg gets over 'b' leg is most likely to take its participants for a Roller Coaster Ride In this Coming Week.


So its better to be a spectator to this Tennis Match between Bulls and Bears within the Range of 4945-5135 (+/- 30 points). The Range may expand as 'b' leg is most likely to take the shape of Expanding Triangle.


So the key for next week is to remain on sidelines and wait for clear Trending Signal. Once this Tennis Match gets over Nifty would Resume its Upward Journey towards 5350-5400 in 'c' leg. Those who missed this Rally can Buy on Dip to 4945.


So lets Wait & Watch


Thanks & Regards,


Harsh Dixit.

5 June 2012

WILL NIFTY REPEAT THE HISTORY?

Hi Friends,


Nifty has been sliding continuously since last few weeks and there is no respite for Bulls.


Though It witnessed intermediate Relief Rallies; It is still missing Long Haul of Bull.


But when this correction will End?


Well as the logic says in Adversity lies Opportunity. 


Currencies Globally have already started Reversing, Indices have yet to begin.
NIFTY
On Daily Chart Nifty managed to give closing above 4830 & 5 wave decline in the C leg Looks Complete. Also We have Positive Divergence On RSI. So today's low Might be the Bottom for Nifty. But on Intra-day Chart 5 wave decline still appears incomplete. And 1 last leg Down in Panic Sell Off may take Nifty lower to 4729 or 4703.


VIX Also Reaching near 30. So I'm awaiting such Panic Sell Off & VIX to touch 30 levels.
INDIA VIX
Once this Downward Correction gets over Nifty is likely to retrace up to 61.8% to 78.6% of the Entire Fall.
NIFTY


So lets Wait & Watch.


Thanks & Regards,


Harsh Dixit.


4 June 2012

CURRENCY UPDATE

Hi Friends,

It is generally observed that Currency Movement gives Early Indication of Equity Market Direction.

Here are some Currency Charts which are indicating a short term Reversal on the cards.
DOLLAR INDEX
Lets 1st look at the Dollar Index Chart which is villain for all the equities, commodities & other currencies with which it is paired. The Dollar Index which has Long way to go to 89-90 has completed its 5 Wave Advance and is setting up for Reversal in Global Equities along with itself. It could retrace back to 61.8% of this advance to 80.49.
EUR/USD
 Now lets look at this Other Equally Important Global Currency which is paired with Dollar. The EUR/USD seem to have completed its 5 wave decline & is setting up for Pull Back Rally up to 1.29 i.e. 61.8% of this decline.

Finally lets look at this USD/INR chart. While INR making New Low Nifty has not yet made the New Low. But with Friday's turmoil in Global Markets Nifty is likely to finally make New Low around 4731 before it could Reverse.
USD/INR
Well this USD/INR Chart also seem to have completed 5 Wave Advance and is setting up for a Reversal. It could Retrace back to 52.85 or 51.95.

Now with the Currencies Signaling Reversal; Relief Rallies in Equities across the Globe are also due on the Cards.

So let’s Wait & Watch


Thanks & Regards,

Harsh Dixit.